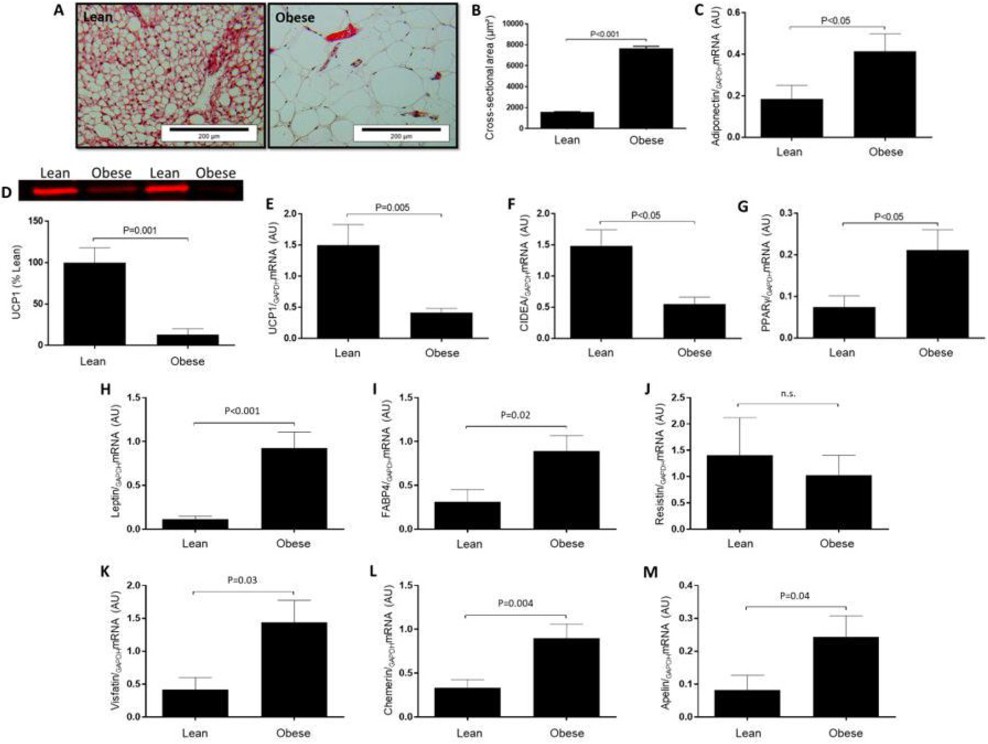
Fig. 6.Representative histological images of Lean and Obese CVAT (A) and cross-sectional area of adipocytes (μm²) (B). Protein expression of UCP1 (D) and mRNA expression of UCP1 (E), adiponectin (C), CIDEA (F), PPARγ (G), leptin (A), FABP4 (B), resistin (C), visfatin (D), chemerin (E), apelin (F) in CVAT from lean and obese ZSF1. The values are given as means ± SEM. n = 6-8 animals per group.